


Bitcoin Forecast Is indecision returning to BTC
Despite last week’s recovery, Bitcoin is once again facing an indecision bias that is becoming more evident in its short-term movements. On average, BTC has recorded a variation of just over 1.00% during the last 3 sessions, while more indecision candles are beginning to appear on the chart, reflecting a renewed neutral bias around the cryptocurrency.
Written by
Julian Pineda
Market Analyst
Despite last week’s recovery, Bitcoin is once again facing an indecision bias that is becoming more evident in its short-term movements. On average, BTC has recorded a variation of just over 1.00% during the last 3 sessions, while more indecision candles are beginning to appear on the chart, reflecting a renewed neutral bias around the cryptocurrency.
Part of this indecision phase, which is preventing a more consistent price recovery in the short term, could be related to the renewed lack of activity around the BTC network. This could also be associated with the greater appeal of relevant substitute markets, such as U.S. bonds and the dollar, which may currently be reducing demand strength around Bitcoin. If this effect continues, the current indecision phase could remain relevant over the next few sessions.

Is demand failing to stabilize?
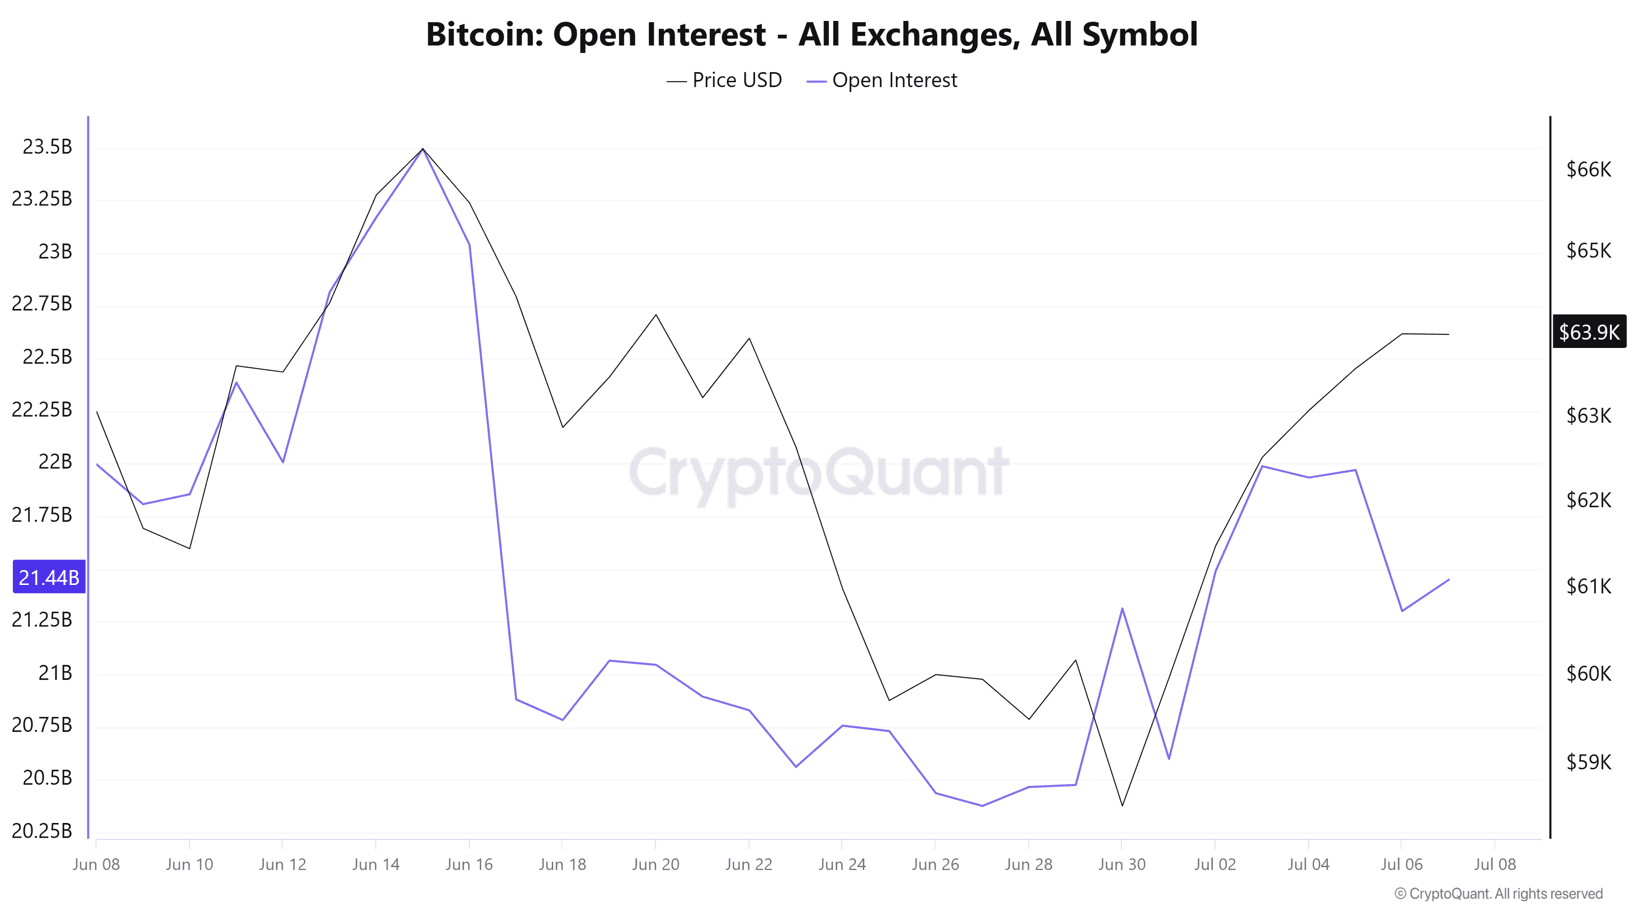
Despite the recovery attempts seen in previous sessions, a loss of strength in demand around Bitcoin has become evident again. This can be observed in the Open Interest indicator, which measures the total number of open buy and sell positions across major exchanges.
The indicator has shown a significant decline from the 22 billion area to the current 21.4 billion zone, reflecting an exit of positions from the market in the short term. As BTC price movements have shown consistent flattening, part of this loss in open positions could be coming from long positions.
This once again reflects a cautious dynamic around BTC demand and could be showing a reduction in the buying strength observed last week.
Source: Cryptoquant
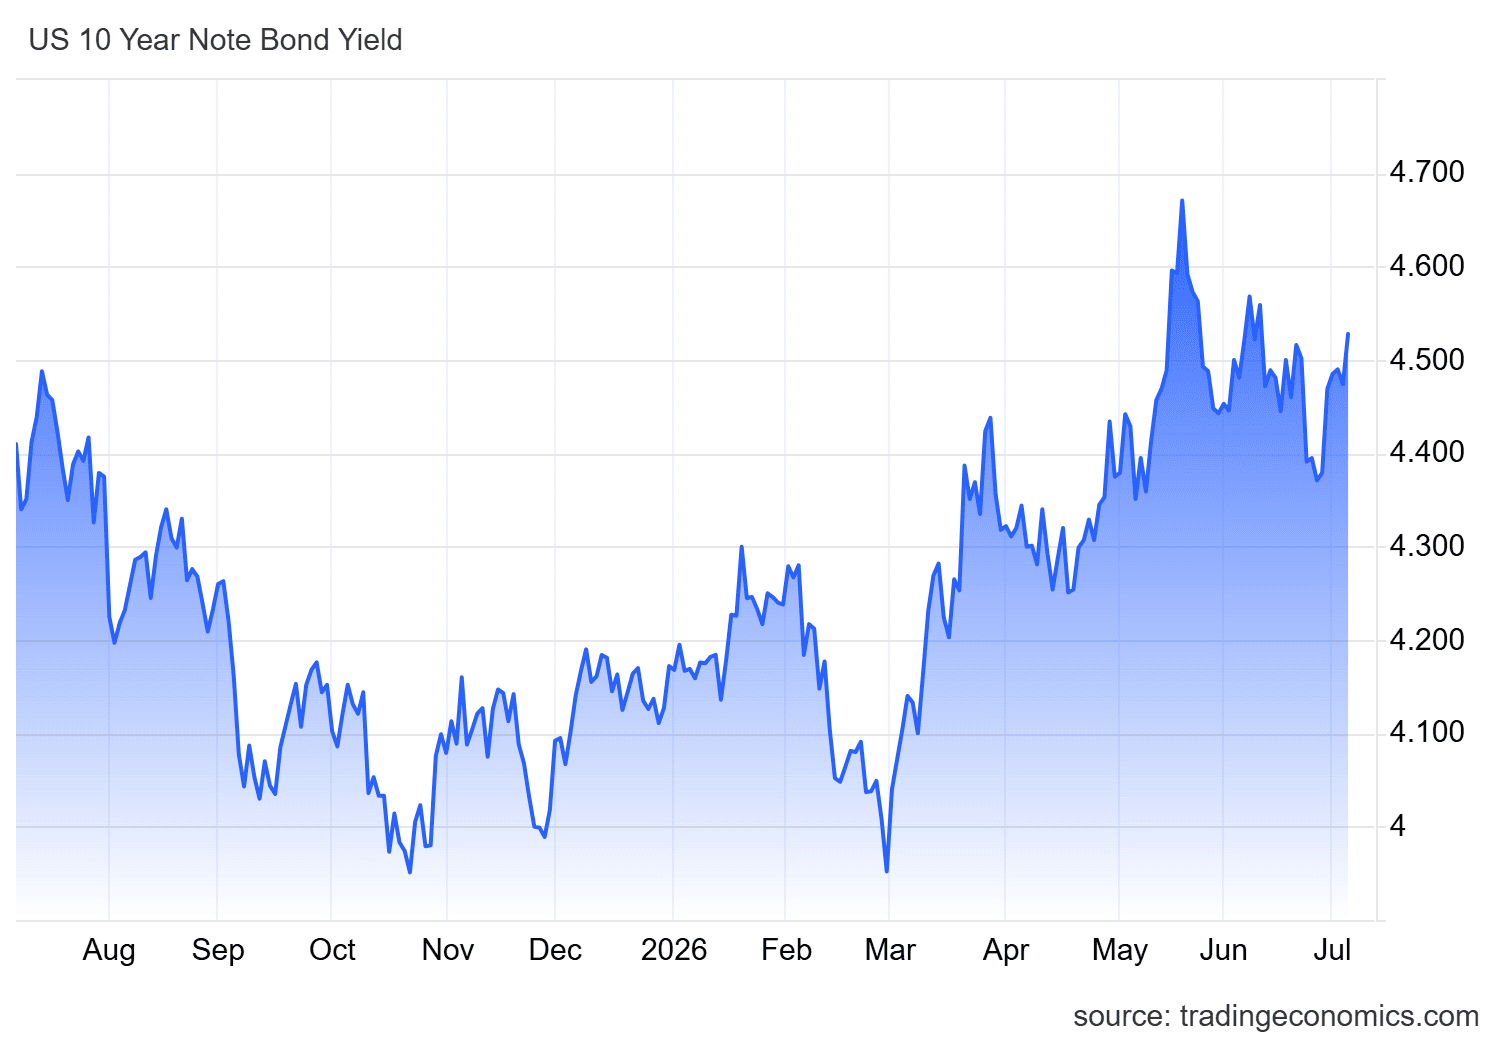
It is important to note that this dynamic has coincided with relevant behavior in the 10-year U.S. bond yield. During the same period in which activity around BTC has declined, there has been a significant increase in the interest rate, with a positive slope and levels even above the 4.5% reference area.
This indicates greater stability in this type of security and suggests that its appeal could be attracting greater foreign capital demand toward U.S. dollar-denominated assets in the short term.
Source: TradingEconomics
The key point in this dynamic is that, for months, both the dollar and the bond market have acted as relevant substitute markets for BTC. As the appeal of more stable markets strengthens, risk appetite can decline, affecting demand for assets such as Bitcoin.
For this reason, the current market dynamic may remain quite similar. If the appeal of these substitute markets continues to grow, demand indecision could become more relevant in BTC movements over the next few sessions.
Confidence remains in sensitive territory
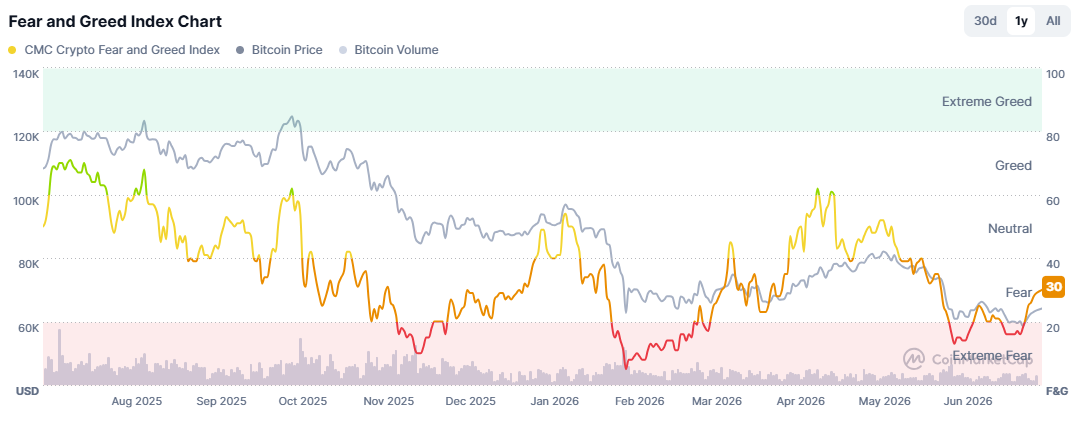
Looking at the average movements of the Fear and Greed Index for the cryptocurrency market, the indicator has advanced toward the 30-point area, showing an improvement compared to previous weeks. However, it still remains in sensitive territory, as it continues to sit within the “fear” zone in the short term.
This shows that, although there has been a recovery, market confidence is still not fully positive. Caution remains evident in the movements of the confidence indicator.
Source: Coinmarketcap
This point is important because, if sentiment remains in negative territory, it will be difficult to build a favorable environment for consistent cryptocurrency demand. If the index remains weak, it could indicate that participants’ perception is still deteriorated, limiting demand inflows into Bitcoin and potentially maintaining a relevant phase of indecision over the next few sessions.
Technical forecast for Bitcoin
Source: StoneX, Tradingview
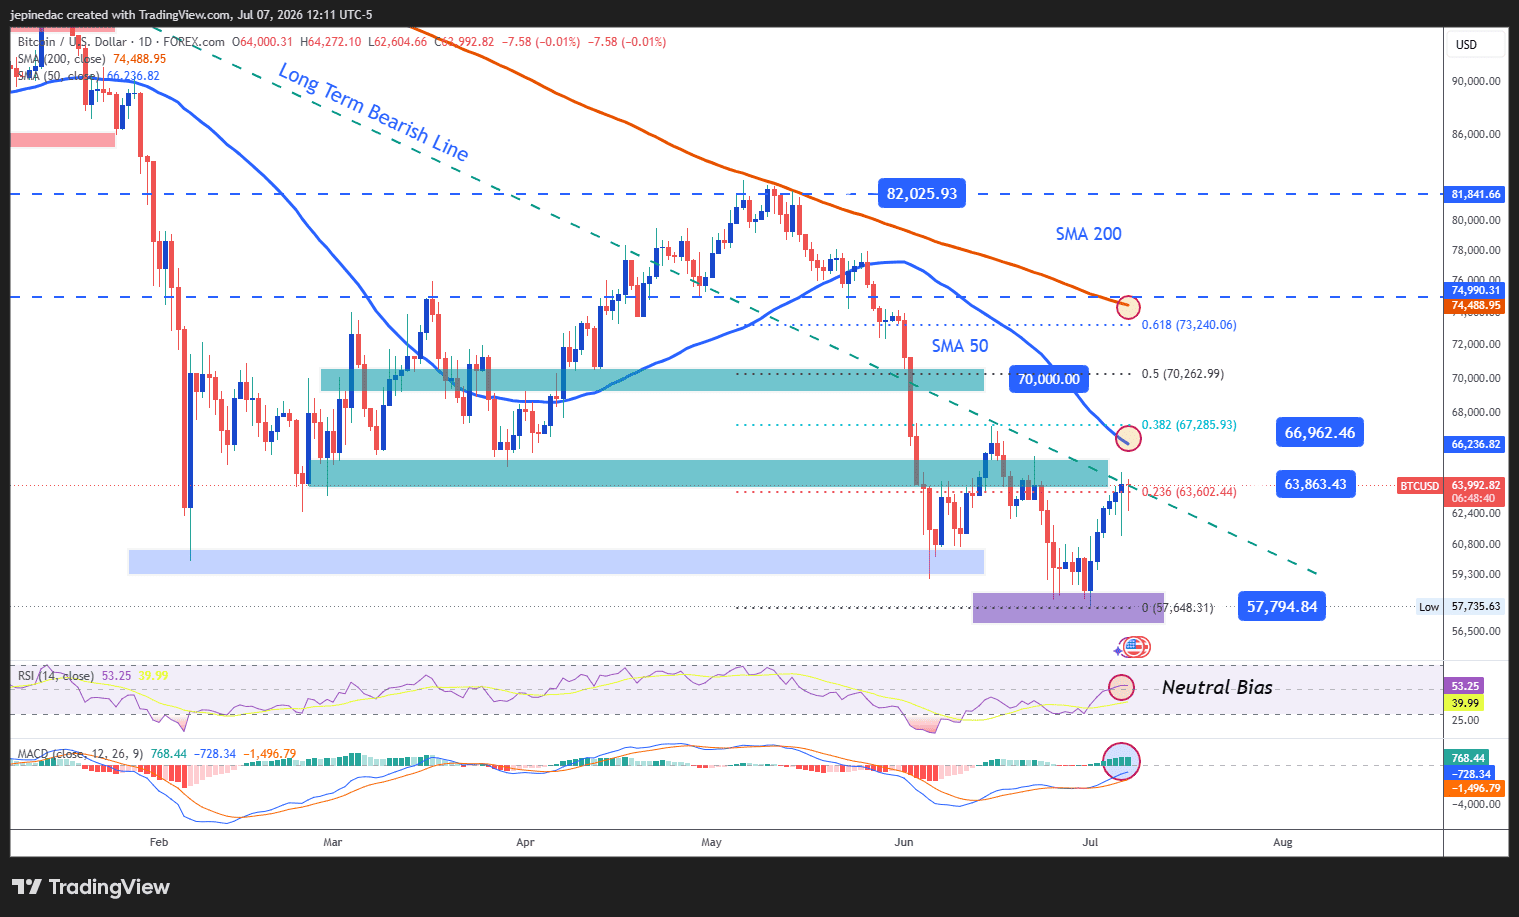
- Long trend line at risk: Now, the recovery in BTC price over the last few sessions has approached the barrier marked by the long bearish trend line, which has been relevant during the last few months of trading. If significant buying pressure manages to hold over the next few sessions, a break of this pattern could begin to develop. This would possibly highlight a more relevant phase of indecision in the broader chart outlook, with price entering a stage without clearly defined trends.
- MACD: The MACD indicator maintains a histogram with movements above the neutral 0 level, signaling that the average bullish strength of short-term moving averages remains relevant. However, the histogram has also started to flatten in its advance, which may point to a loss of short-term momentum in buying strength over the next few sessions.
- RSI: A slightly different scenario can be seen in the RSI indicator, as its line continues to move quite close to the neutral 50 area. This suggests a balance in the average bullish and bearish impulses of the last 14 sessions. This reading also highlights that the current price indecision phase could remain relevant in the short term.
Key levels:
- 66,900 – Important resistance: This key bullish barrier corresponds to the area marked by the 38.2% level of the most relevant Fibonacci retracement on the chart. It also coincides with the barrier marked by the 50-period simple moving average. Price movements above this level could fully break the dominant bearish trend line and open room for a stronger buying bias over the coming weeks.
- 63,800 – Near-term barrier: This relevant neutral level corresponds to the base of the long bearish trend line and also to the 23.6% Fibonacci retracement level. This area corresponds to the current major price retracements. For that reason, movements too close to this level over the next few sessions could highlight an important phase of indecision and even open room for the formation of a more relevant sideways range in the short term.
- 57,790 – Definitive support: This recent low zone coincides with the 2026 lows. Moves below this level could reinforce a dominant selling bias and open room for a significant extension of the bearish trend line over the coming weeks.
Written by Julian Pineda, CFA, CMT – Market Analyst
Follow him on: @julianpineda25
Related tags:






Web Trader platform
Our sophisticated web-based platform is packed with features.
Open an account today
Experience award-winning platforms with fast and secure execution.
Economic calendar
Related articles

Bitcoin Forecast: BTC/USD Back to $80K Ahead of Warsh’s Jackson Hole Speech
After surging over $15,000 in the past 10 days alone, there is risk of a near-term pullback if Warsh says anything remotely hawkish at Jackson Hole - what are the levels to watch from here?


Bitcoin’s failed breakouts are becoming hard to ignore
Three failed breakout attempts and fading momentum have put Bitcoin bulls on notice. Another rejection could open the door lower just as attention swings back towards NVIDIA and the AI trade.


US Dollar, Gold & Bitcoin Weekly Technical Outlook 8 24 2026
Key levels on active technical setups in DXY, Gold, and Bitcoin heading into the start of the week.