

Bitcoin Price Forecast: BTC/USD Rally Challenges a Major Trend Reversal 7 23 2026
Bitcoin's sharp recovery has shifted focus from survival to confirmation as bulls confront the technical hurdle that could redefine the broader trend.
Written by
Michael Boutros
Sr. Technical Strategist
Bitcoin Technical Forecast: BTC/USD Weekly & Daily Trade Levels
- Bitcoin has rebounded sharply from a major multi-month support zone after registering an exhaustion low int the start of June.
- The recovery is now challenging a critical confluence of resistance that could determine the broader trend.
- Weekly momentum continues to improve, suggesting bearish pressure may be fading.
- Building RSI divergence suggests downside momentum may be fading, raising the threat of an exhaustion low.
- A breakout above current resistance would strengthen the case for a more significant low.
- Risk sentiment and geopolitical developments remain key drivers into the weekly close.
Bitcoin has rallied nearly 16% from this month's low after reversing sharply from a major multi-year support zone highlighted in our previous outlook, bringing the focus back to whether the cryptocurrency has finally carved out a more durable bottom. The recovery is now approaching key resistance where multiple technical factors converge, making this one of the most important tests since the decline began. A decisive break above this barrier would strengthen the case that a larger trend reversal is underway, while another rejection would keep the broader corrective outlook intact heading into the weekly close.
Bitcoin Price Chart – BTC/USD Weekly
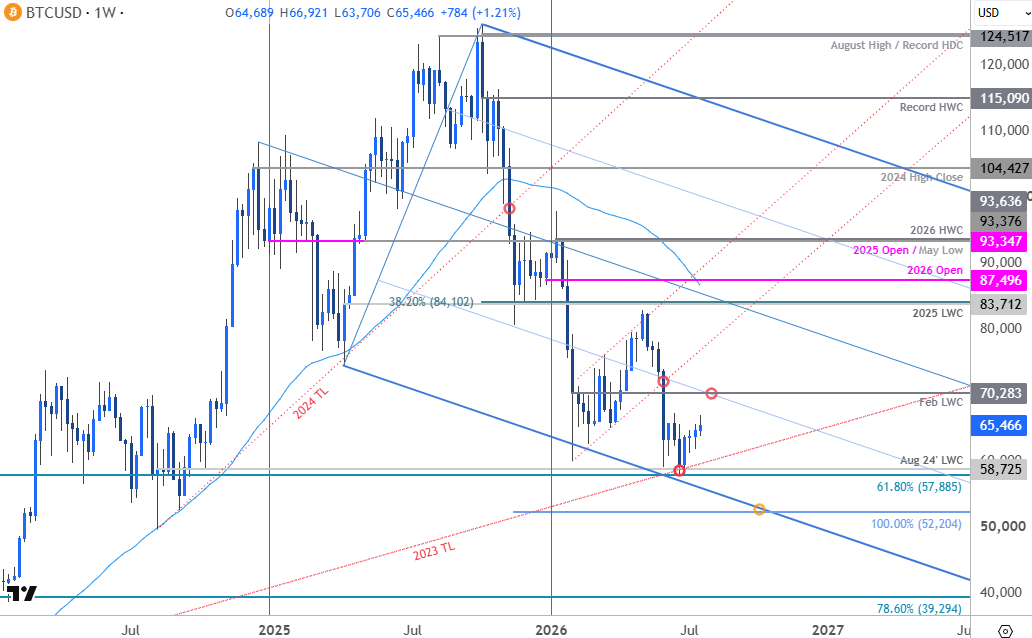
Chart Prepared by Michael Boutros, Sr. Technical Strategist; BTC/USD on TradingView
In last month’s Bitcoin Forecast we noted that BTC/USD was, “testing a critical support zone noted in our 2026 trade of the yearly at 57,885-58,725- a region defined by the 61.8% retracement of the 2022 advance and the August 2024 low-week close (LWC). Note that the lower parallel of the 2025 pitchfork and the 2023 trendline converges on this zone over the next week and the focus is on a possible price inflection off confluent support in the days ahead… Keep in mind we are on the lookout for a potential exhaustion low as this correction matures.” Bitcoin registered an intraday low at 57,735 the following week before reversing sharply higher with a four-week rally extending more than 15.9% off the yearly low. Weekly RSI divergence continues to suggest the bearish momentum is waning and the focus is on whether the bulls can stabilize above this key threshold.
Bitcoin Price Chart – BTC/USD Daily
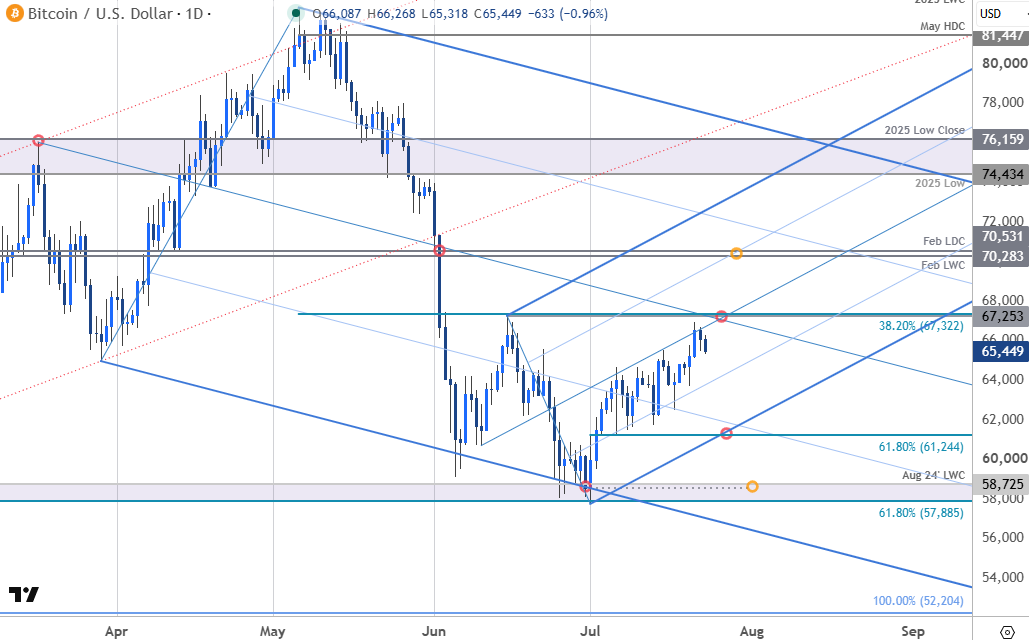
Chart Prepared by Michael Boutros, Sr. Technical Strategist; BTC/USD on TradingView
A closer look at the Bitcoin daily chart shows BTC/USD trading within the confines of an ascending pitchfork extending off the monthly low. The rally is approaching confluent resistance this week at the June 15 swing high, and the 38.2% retracement of the May decline at 67,253/322. Note that median lines of the near-term uptrend and the broader downtrend converge on this level into the close of the month and a breach / close above would be needed to suggest a more significant low is in place and a larger trend reversal is underway. Subsequent resistance objectives are eyed at the February low-day & low-week closes (LWC / LDC) at 70283/531 and the 2025 low / low-close at 74,434-76,159. The May downtrend converges on this level next month and gains surpassing this threshold would put the bulls back in control.
Initial support now rests with the 61.8% retracement of the monthly range at 61,244. This level converges on the lower parallel over the next few days and losses below this slope would threaten resumption of the May downtrend. Key support remains unchanged at 57,885-58,725 and losses below this mark would threaten another bout of accelerated losses for the cryptocurrency with the next major technical consideration eyed at the 100% extension of the decline off the record 2025 high at 52,204.
Bottom line: Bitcoin has rebounded form a key confluent support zone at the lower bounds of a multi-month downtrend. From a trading standpoint, losses would need to be limited to 61,244 IF price is heading higher on this stretch with a breach / weekly close above 67,322 needed to suggest a more significant low was registered this month. Note that risk sentiment has been under pressure amid the expanding war in Iran and the focus will be on whether the bulls can step in to defend this support zone. Stay nimble here and watch the weekly closes for guidance.
--- Written by Michael Boutros, Senior Technical Strategist
Follow Michael on X @MBForex








Web Trader platform
Our sophisticated web-based platform is packed with features.
Open an account today
Experience award-winning platforms with fast and secure execution.
Economic calendar
Related articles

Euro Short-term Outlook: EUR/USD Pullback Nears Pivotal Uptrend Support 8 28 2026
Warsh's comments accelerated the EUR/USD selloff, raising the stakes as buyers look to stabilize the broader recovery.

AUD/CAD breakout puts the Bradman barrier in sight
A bullish breakout has pushed AUD/CAD to its highest level since early 2021. Whether it can clear 0.9994 may determine if the move extends well above parity.


Australian Dollar Forecast: AUD/USD Breakout Rally Nears Pivotal Resistance 8 27 2026
Aussie has advanced in eight of the past nine weeks, but the next technical hurdle could determine whether bulls can sustain the broader advance.